England & Wales Housing Decision Support
Explainable where-to-live decision support for England & Wales. A tested dbt + DuckDB engine turns nine open-data sources into five transparent 0–100 indicators across 7,264 neighbourhoods, every score shown beside the raw figure it came from, served through a public FastAPI and a Next.js site with ~7k programmatic area pages. 228 dbt data tests + 2 unit tests, a versioned cross-runtime scoring contract, Dagster-orchestrated refresh, published lineage docs.
Key finding
What I built
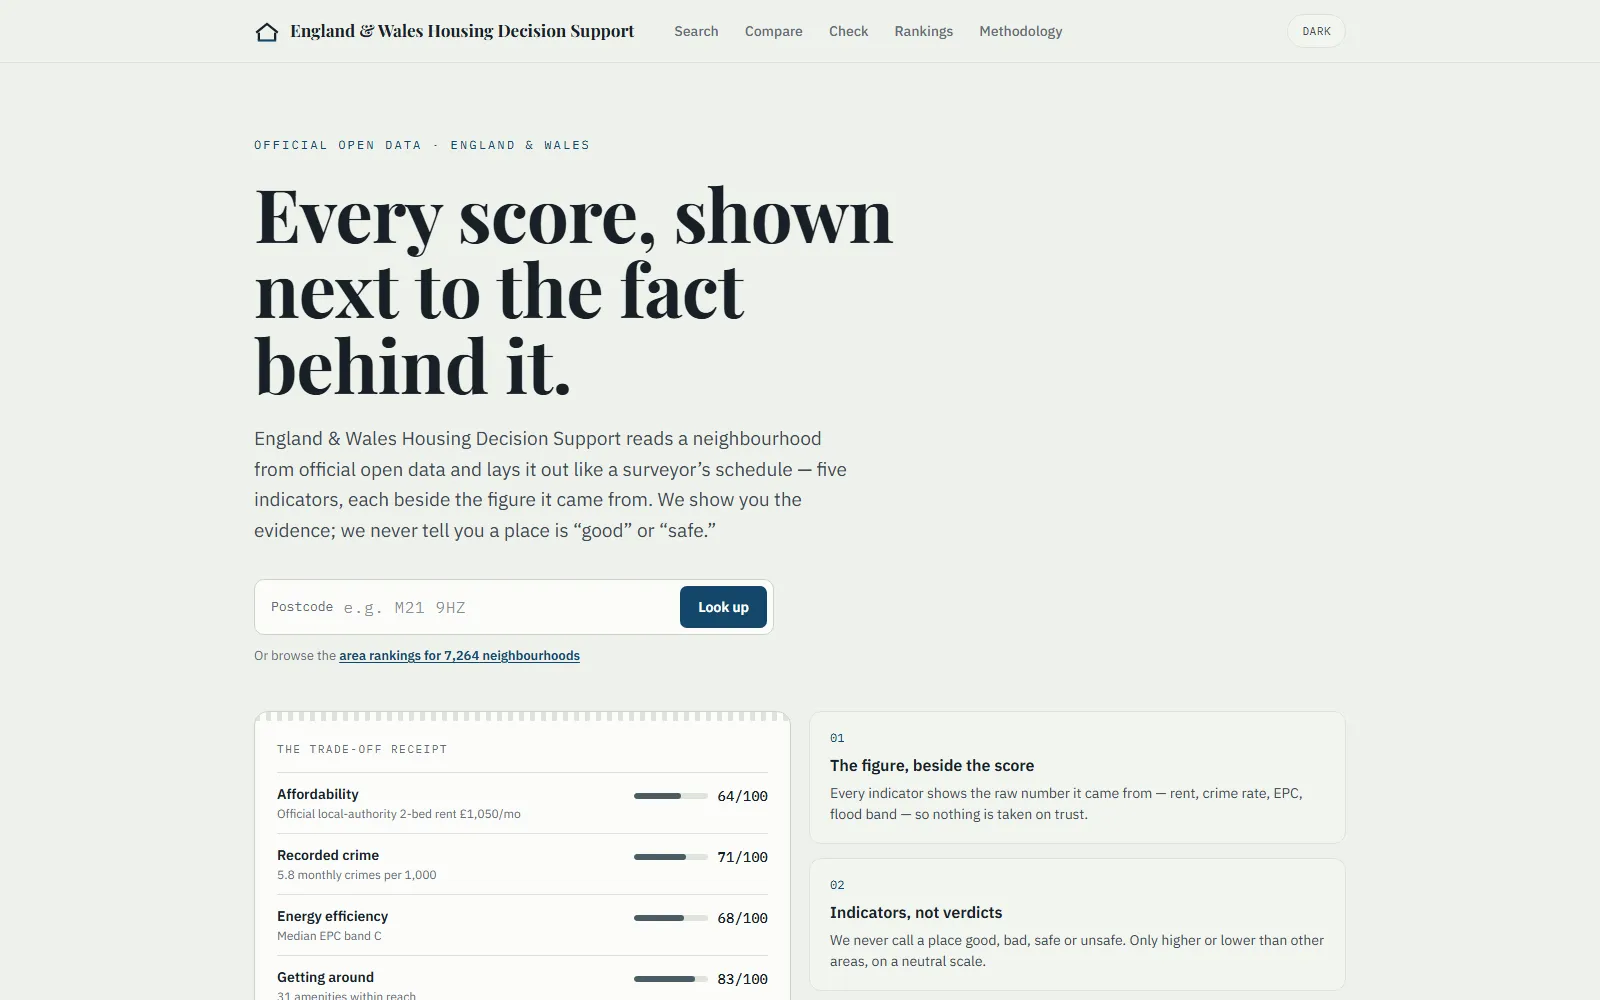
The site reads a neighbourhood from official open data and lays it out like a surveyor’s trade-off receipt — five indicators, each beside the figure it came from. It shows the evidence; it never tells you a place is “good” or “safe”.
The “where to live” framing is the vehicle. The substance is the pipeline, the dimensional and decision modelling, the tests, and the explainability layer. A reference analytics-engineering project, not a product.
The data engine
Nine authoritative open-data sources, rolled to MSOA grain across the 7,264 England & Wales neighbourhoods:
- Sale-market context: 4.99M Land Registry transactions (2021–2025)
- Geography: ONSPD bridge, 2.73M postcodes (99.999% coverage)
- Rent & affordability: ONS PIPR, including per-bedroom rents
- Energy: 23.5M EPC certificates → per-area median band
- Crime: 17.1M police street crimes as an approximate monthly rate (an indicator, never a verdict), against official ONS mid-2024 populations
- Population: ONS mid-year estimates as the crime-rate denominator
- Flood & planning: spatial point-in-polygon; England-only sources, so Welsh areas are reported as not covered, never given a favourable default
- Convenience: 437k OpenStreetMap amenities, nearest + walkable count
Sources → staging → intermediate → marts, tested at every layer: 228 dbt data tests plus 2 dbt unit tests, with lineage and column-level docs published to GitHub Pages on every push. Each source is fixture-default for fast, reproducible CI with a real-data toggle for production builds.
Explainable scoring — readable top to bottom
The score is a transformation you can read (rpt_neighbourhood_score), not a
black box. Continuous indicators get a median-anchored, winsorised
normalisation to 0–100, so magnitude survives — a pure percentile rank would
force a uniform spread and make every area look extreme. The overall score is
a weighted geometric mean, so one excellent pillar can’t mask a poor one.
Missing indicators are dropped, never zeroed: a gap lowers the area’s
evidence-quality level instead of silently penalising it. Every score ships
beside its raw figure with a generated “why this area” sentence, and a
versioned machine-readable scoring contract with golden cases holds the SQL,
Python and TypeScript implementations in parity.
Orchestration and delivery
Land Registry data refreshes monthly, so the refresh is a Dagster asset
graph: ingestion (with a pre-dbt data-quality gate) → dbt → a slim
decision.duckdb extract. A thin FastAPI service on Fly.io serves that
extract publicly with OpenAPI docs. The Next.js site on Vercel (search,
compare, listing checker, ~7k programmatic area/town/region/rent pages) is
just one HTTP client of it.
Honest limits
The UK area-data space is already well served, and the repo says so up front. Indicators, never verdicts; missing data lowers evidence quality rather than becoming a silent zero. Planning and flood sources cover England only, and the data refreshes on a monthly cadence, not in real time. The project is complete and maintenance-only, with no active feature roadmap.