Community Energy Flex
Works out when to run flexible electricity loads — a wash, an EV charge — to cut cost and carbon from live UK grid data, and shows the working: an LP/MILP optimiser behind a typed FastAPI contract, a Next.js planner, and a scenario retro that re-scores a plan under alternative carbon curves. Product development stopped in July 2026 after a scan found the scheduling function already served by a statutory smart-tariff duty and three shipping products — recorded with its primary sources rather than quietly abandoned.
Key finding
What it does
The community-energy-flex web app doesn’t just show “carbon is low at
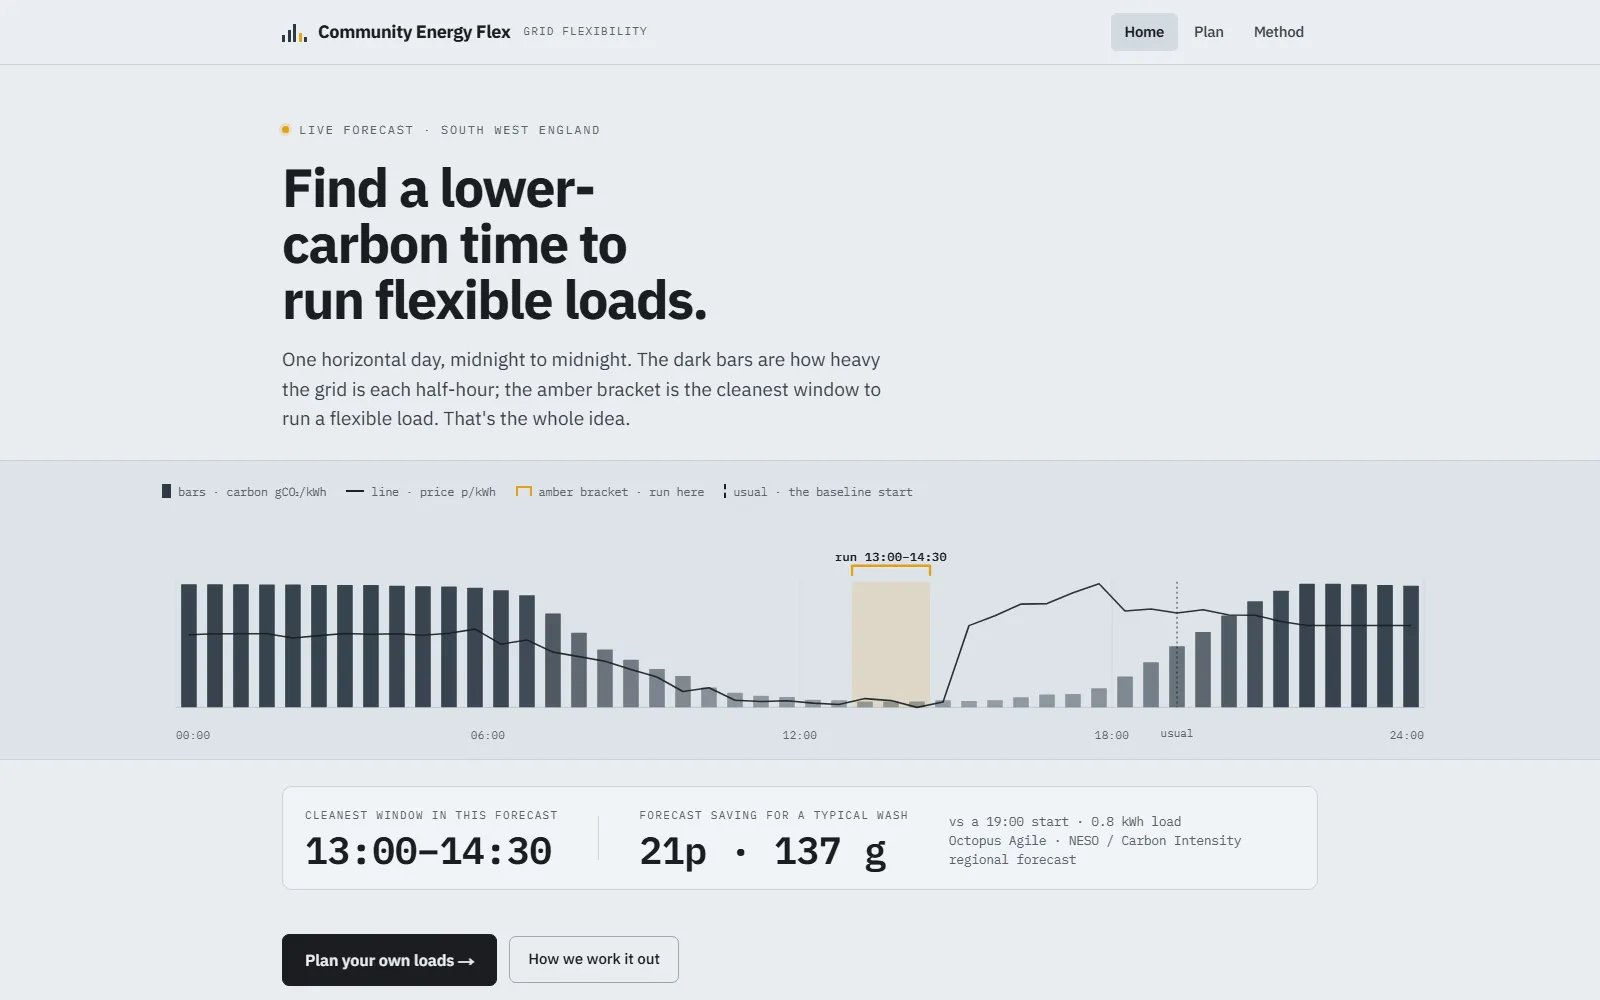
02:00” — it says “run the washing
machine 02:30–04:00, charge the EV 01:30–04:30, expected saving £0.12 and
0.14 kg CO₂, strong robustness”, with the assumptions and caveats attached. The
indicator is a heuristic robustness band, not a calibrated confidence — the
v0.2.0 closeout renamed it for exactly that reason.
Why it exists
A learning / personal-utility build, not a product — Octopus already publishes a free greener-nights forecast, and free sites do this on the same public data. That’s stated up front in the repo. The value is the engineering on display: a complete data path from live public APIs → a warehouse → an optimiser → a typed API → a front end.
The engineering
- An LP/MILP optimiser schedules flexible loads against live UK grid carbon and price data, per region and tariff.
- Contract-first, typed end to end: pydantic models → OpenAPI → generated
TypeScript, so the API and the front end can’t silently drift. The
API is public and keyless,
so you can
curl /v1/optimisedirectly. - Graceful degradation by design: every live feed is TTL-cached with a last-good / sample fallback, so an upstream outage never takes the app down.
- A DuckDB warehouse layer under dbt, with a Power BI semantic model and its own DAX measure layer behind the analytical views. Snowflake exists as a bootstrap DDL script and a second dbt profile target only — nothing here has been built against a live Snowflake account, and the repo forbids saying otherwise.
- Every downstream consumer declared as a dbt exposure at
maturity: high— FastAPI, Next.js, Power BI and the action report — so a model change that would break a consumer fails the build.fct_daily_savingscarries an enforced contract across all 33 columns.
It closes the loop — on scenarios, not on outcomes
Most planners stop at the forecast. This one re-scores a plan under alternative carbon curves: take the schedule it chose, replay it against a curve that is dirtier, cleaner, noisier or time-shifted, and report how the saving holds up. Every scenario in the current set still saves.
What it is not is a measurement of anything that happened. There is no stored forecast vintage and no realised grid data behind it — the curves are constructed transformations of a sample, and the repo’s claim ledger lists “the synthetic retro workflow measures realised household savings” as not supported, with schedule adherence explicitly unobserved. The site used to quote ratios from those scenarios as though a plan had been checked against a real outcome; the repo runs a CI gate that fails the build if those figures appear in its own docs, and this page now honours it.
Honest limits
Planning advice only — it does not control appliances, guarantee savings, or replace supplier advice. Savings are small per-household by design; the worked example is a community centre with four flexible loads, where a single day of shifting comes to £0.41 and 0.49 kg CO₂ on synthetic data. The v0.2.0 closeout deliberately retired the annualised version of that figure as a lead claim, so it is not quoted here either.